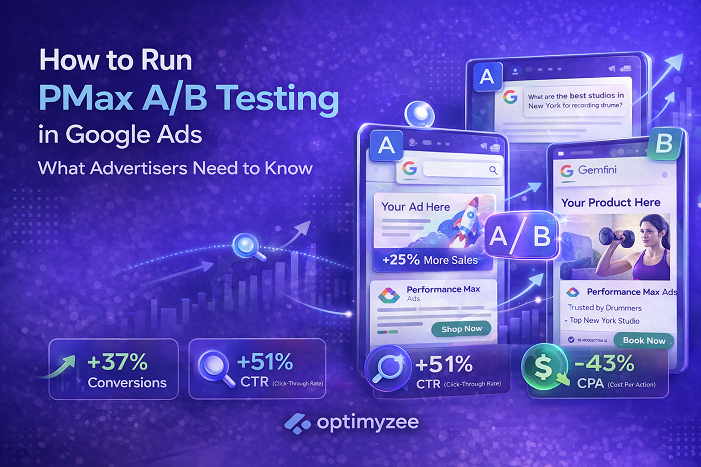
Quick Answer: In January 2026, Google expanded built-in A/B testing for creative assets to all Performance Max campaigns – not just retail. You can now compare two sets of assets within a single campaign without creating duplicate campaigns. Tests run for 4–6 weeks minimum. This is the most significant control update PMax has received, and it directly addresses the main complaint advertisers had: no way to validate which creatives are actually driving performance.
Performance Max has always had a reputation problem among advertisers who like to know what is working. The automation is real – it finds converting audiences across Search, Display, YouTube, Gmail, and Discover simultaneously. But the opacity was equally real: asset performance ratings of Low, Good, and Best told you relative rankings within your own campaign, not whether a new creative direction would outperform your current one.
That changed in January 2026. Google expanded its built-in A/B testing framework for PMax assets to all campaign types – previously only available for retail campaigns since October 2024. You can now run a controlled experiment comparing two different asset sets within the same campaign, with a defined traffic split and a proper experiment report showing statistical significance.
This guide explains how the feature works technically, how to set up a test correctly, what you can and cannot test, and the common mistakes that produce unreliable results.
Why PMax Asset Testing Matters
Before this feature existed, the only way to test creative hypotheses in Performance Max was to create a separate duplicate campaign – a methodology with significant flaws. Two campaigns running simultaneously would have different audience distributions, different learning phase states, and different budget allocations. Any performance difference between them could be explained by a dozen factors other than the creative assets themselves.
The result was that most PMax advertisers either relied on asset performance ratings (a blunt instrument) or made creative decisions based on intuition rather than data. This was particularly problematic for high-budget accounts where creative direction choices had material revenue implications.
Built-in A/B testing solves this by running both asset variants within the same campaign – same audience signals, same bidding strategy, same budget, same learning phase. The only variable that changes is the creative. That isolation is what makes the results meaningful.
🔍 Search Engine Land noted when the feature launched: ‘Running tests inside the same asset group isolates creative impact and reduces noise from structural campaign changes. The controlled split gives clearer reporting and helps teams make rollout decisions based on performance data rather than assumptions.’
Source: Search Engine Land ‘Performance Max Built-in A/B Testing for Creative Assets Spotted’ (February 2026)
How the Experiment Framework Works
The framework divides your asset group into three categories:
Control Group (Assets A): Your existing asset set. These are the assets currently serving in your campaign, acting as the baseline for comparison. Whatever is working today becomes the benchmark.
Treatment Group (Assets B): The alternative asset set you are testing. This can be entirely new creative, variations of existing assets with different messaging, different imagery styles, different video content – whatever hypothesis you want to validate.
Common Assets: Assets you exclude from both groups. These continue serving to 100% of campaign traffic alongside whichever variant a user is assigned to. If there are assets you consider permanent fixtures – a specific logo, a legally required disclaimer image – place them here.
Traffic is split between control and treatment according to a percentage you define. The default is 50/50, but you can weight it differently – for example 70/30 if you want to preserve more traffic on the proven control while still generating enough treatment data to reach statistical significance.
📌 When an experiment starts, the asset group enters view-only mode – you cannot edit, add, or remove assets until the experiment ends. This is intentional: asset changes during a test would invalidate the results. Plan your creative assets completely before launching.
The Experiment Guidance System calculates the required test duration based on your campaign’s conversion volume and traffic. The minimum recommended duration is 4–6 weeks. This accounts for Performance Max’s learning phase and the time needed for ad delivery to stabilise across all channels.
Sources: Google Ads Help ‘About Performance Max optimization experiments: A/B testing assets (Beta)’, ALM Corp comprehensive guide (February 2026)
Three Test Types You Can Run
1. Asset Set A vs Asset Set B
The most flexible test type. You designate some existing assets as Control and upload new assets as Treatment. Google tests both sets and reports on which combination produces better performance. Use this to validate creative directions – different headline approaches, different visual styles, different video content.
2. Assets vs No Assets (Feed-Only vs Assets)
For e-commerce campaigns running on product feeds only: this test adds creative assets (text, images, videos) to the Treatment group while the Control group runs on the product feed alone. It answers the question: does adding creative assets to a Shopping-focused PMax campaign increase conversion value?
This is particularly useful for retailers who want data before committing to creative production investment. If adding creative assets does not meaningfully lift ROAS, the production cost may not be justified for that specific campaign.
3. Video vs No Video
Tests whether including video assets changes campaign performance. Control group runs without any video. Treatment group includes your video assets. Both user-uploaded and auto-generated videos are suppressed in the control group.
This helps answer whether YouTube and video placements are contributing meaningful conversions to your PMax results – and whether the production cost of video assets generates sufficient return to be worth maintaining.
Step-by-Step Setup Guide
- Go to Campaigns → Experiments in your Google Ads account
- Click the blue + button to create a new experiment
- Select ‘Performance Max’ as the campaign type
- Choose your test type (Asset A/B, Feed Only vs Assets, or Video)
- Select the PMax campaign you want to test
- Define your Control assets – select which existing assets form your baseline
- Define your Treatment assets – select existing assets or upload new ones
- Move any permanent assets to Common Assets if applicable
- Set your traffic split (default 50/50; adjust based on risk tolerance)
- Review the experiment duration suggested by the Guidance System – accept the recommended end date unless there is a specific reason to shorten it
- Schedule the experiment – note that start date is always the following day
⚠️ Your campaign must not have a shared budget, be part of a portfolio bidding strategy, or be using Smart Bidding Exploration when you create the experiment. If any of these apply, you will receive an error and need to remove those settings before proceeding.
How to Read Your Results
Results appear in the Experiment Report page in your Experiments section. The key metric to look for is whether you have enough data to reach a statistically significant conclusion. Google’s system will tell you directly whether results are conclusive.
What to look for:
- Conversion volume delta between control and treatment – is the treatment generating more conversions at a similar or lower cost?
- Cost per conversion – if treatment produces more conversions but at proportionally higher cost, the net impact may be neutral
- Conversion value – for e-commerce, the revenue impact matters more than conversion count
- Statistical significance – Google will flag whether results are conclusive; do not apply a winner based on directional results that have not reached significance
When the experiment concludes, you have two options:
Apply experiment: Updates your asset group with the treatment assets. You choose whether to add treatment assets alongside control assets, or to replace control assets entirely.
End experiment: Stops the test without changes. New treatment assets are discarded. The asset group reverts to its original state.
💡 Do not rush to apply a winner. If your experiment ends at 4 weeks and results are not yet conclusive – meaning the difference between control and treatment is within statistical noise – extend the experiment or run a follow-up with a larger traffic allocation to the treatment group.
What You Can and Cannot Test
You can test
- Different headline approaches – features vs benefits, urgency vs informational, brand vs product-led
- Different image styles – product-only vs lifestyle, studio vs UGC, seasonal vs evergreen
- Different video content – short-form vs long-form, testimonial vs demonstration, brand-led vs offer-led
- Different description approaches – USP-focused vs social proof-focused
- Adding assets to a feed-only campaign vs no assets
- Video vs no video
You cannot test
- Multiple asset groups simultaneously within one campaign – tests are limited to one asset group per experiment; if your campaign has multiple asset groups, you must test them sequentially
- Audience signals – the experiment tests creative assets only; targeting parameters remain constant
- Bidding strategies – bidding cannot be varied within an experiment
- Landing pages – URL changes are not part of the asset testing framework
- Multiple campaigns simultaneously – one experiment per campaign at a time
🔍 The asset group limitation has a significant practical implication: testing ten asset groups requires 40–60 weeks if each experiment runs the minimum 4–6 weeks. Prioritise ruthlessly. Start with the asset group that receives the most traffic and conversions – that is where experiment results will be most reliable and where a winning creative direction will have the most impact.
Source: ALM Corp ‘Google Performance Max A/B Testing for Creative Assets: Complete Implementation Guide’ (February 2026)
Practical Testing Strategies
Test one variable at a time
If you change headlines, images, and videos simultaneously between control and treatment, you cannot know which change drove any performance difference. Isolate one variable per test. If testing headline approach, keep images and videos identical between control and treatment.
Start with your highest-volume asset group
Lower-traffic asset groups take longer to reach statistical significance – sometimes longer than the practical experiment window. Start experiments with the asset groups that generate the most impressions and conversions. You will get conclusive results faster and can apply learnings to lower-traffic groups.
Build a sequential testing programme
Each experiment should inform the next one. Document your hypothesis before each test, record the result and the margin, and carry the winner forward as the new control for the next experiment. Over 6–8 experiments covering 6–12 months, this compounds into meaningful creative improvement.
Test meaningfully different creative, not minor variations
Two headlines that communicate nearly the same message but with different phrasing will not produce statistically different results – the performance difference will be within noise. Test creative approaches that represent genuinely different strategic directions. A testimonial-led approach versus a features-led approach. UGC-style imagery versus polished studio imagery. These are the tests that produce learnable insights.
💡 Allocate 15–30% of your testing campaigns’ budget to treatment groups if you want faster results. Conservative 20/80 splits reduce risk but slow the pace at which the treatment group accumulates enough data for statistical significance. If your account has strong conversion volume, a 50/50 split reaches conclusive results fastest.
Common Mistakes and How to Avoid Them
Running tests for fewer than 4 weeks. Early results in PMax asset experiments are unreliable because the campaign is still in its optimisation cycle. Traffic distribution stabilises over time. Results at week 2 can reverse completely by week 5. Respect the minimum duration.
Making other campaign changes during the experiment. Changing budget, bidding strategy, audience signals, or any other campaign setting during a live experiment introduces confounding variables. The only thing that should change during the test period is which assets a user sees.
Testing similar assets and expecting different results. Headline A: ‘Get 30% Off Today’ and Headline B: ‘Save 30% This Week’ are not a meaningful A/B test – they communicate the same offer. Test strategic differences, not copywriting variations.
Applying a winner before statistical significance is confirmed. Google’s Experiment Report explicitly tells you when results are conclusive. Applying based on directional trends that have not reached significance is equivalent to flipping a coin and calling it data.
Ignoring asset group limits. Control and treatment assets both count toward your asset group maximums (20 text assets, 20 images, 5 videos – though video limit was raised to 15 in January 2026). If your asset group is already near these limits, you must remove lower-performing assets before adding treatment assets for the experiment.
FAQ
Is the A/B testing feature available to all advertisers?
Google expanded it to all Performance Max campaigns in January 2026, moving beyond the retail-only beta from October 2024. Most accounts should have access through the Experiments section of their Campaigns menu. If you do not see ‘Assets’ as an option in the Experiments framework, contact Google Ads support – beta access is typically granted within 3–5 business days.
Does running an experiment cost extra?
No. There are no additional fees for running asset experiments. You continue paying your normal cost-per-click or cost-per-conversion for ads served during the experiment. Your spend is split between control and treatment variations according to your defined traffic split percentage.
Can I run two experiments on the same campaign at the same time?
No – only one experiment can run per campaign at a time. However, you can run simultaneous experiments across different campaigns in your account. If your campaign has multiple asset groups, you must test them sequentially, not simultaneously.
What happens to my campaign performance during the experiment?
Performance during the experiment reflects the blended performance of both control and treatment groups. If your treatment assets perform significantly worse than control during the test, you may see a temporary CPA increase or ROAS decline. This is the trade-off for generating conclusive data. Run experiments during periods of stable business performance – avoid launching experiments immediately before high-stakes seasonal events.
Can I test audience signals alongside asset changes?
No – the asset A/B testing framework only tests creative assets. Audience signals, bidding strategies, and campaign targeting remain constant throughout the experiment. If you want to test audience signals, you need to use a separate experiment type (campaign-level experiment) rather than the asset-level experiment feature.
The Bottom Line
Performance Max asset A/B testing is the feature PMax advertisers have been asking for since the campaign type launched. The ability to run a controlled creative experiment within a single campaign – without the noise of duplicate campaign structures – is a meaningful step toward making PMax more accountable and more optimisable.
The limitations are real: one asset group per experiment, sequential testing for multi-asset-group campaigns, and 4–6 week minimum durations. But the methodology is sound, and for accounts with sufficient conversion volume, the results are actionable.
The highest-value use of this feature is building a systematic testing programme rather than running one-off experiments. Each test informs the next. Over time, you develop a library of validated creative knowledge that improves not just PMax performance, but your broader understanding of what resonates with your converting audience.
→ Already running Performance Max campaigns and want to ensure the structure is set up correctly before running experiments? Optimyzee helps analyse your campaign architecture – because a solid foundation produces more reliable experiment results.
Sources
Google Ads Help: ‘About Performance Max optimization experiments: A/B testing assets (Beta)‘ – support.google.com
Google Ads Help: ‘About Performance Max optimization experiments: Asset testing‘ – support.google.com
ALM Corp: ‘Google Performance Max A/B Testing for Creative Assets: Complete Implementation Guide for 2026‘ (February 2026)
Search Engine Land: ‘Performance Max Built-in A/B Testing for Creative Assets Spotted‘ (February 2026)
Search Engine Land: ‘Google Launches A/B Testing for Performance Max Assets (Beta)‘ (January 2026)
PPC Land: ‘Google Quietly Expands Asset A/B Testing to All Performance Max Campaigns‘ (January 2026)
Search Engine Roundtable: ‘Google Ads Performance Max A/B Testing Assets (Beta)‘ (January 2026)
PPC News Feed: ‘Performance Max Launches Native A/B Asset Experiments‘ (February 2026)